Data should always be used in education, but should also be analyzed with a critical eye. Having data is just the first step, it then requires the educator to examine it with an open mind and a willingness to accept what the implications of the results are. The following data reflects the last nine years of math and ELA scores for the State of Delaware. The trend for nearly the last decade has been one of stagnation and contraction. Many implications and assumptions can be drawn from this data, and it must be examined with an open mind. If educators in Delaware write off the data to follow as inaccurate, or not applying to them, then this period of non-growth will only continue until attitudes change. The graph below depicts the percentage of Eight-Grade students in Delaware that are below the proficiency level in math.
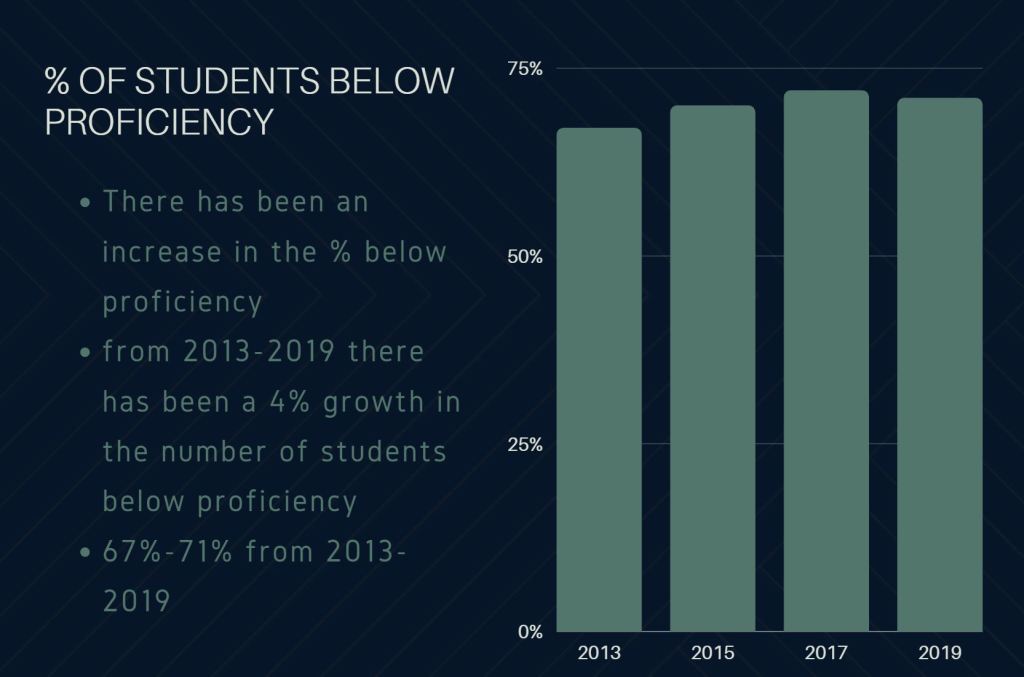
The next step would be to look at the number of students who are at or above proficiency. If this number has increased, then maybe it can balance out the number who are below proficiency. The graph below shows the number of students who are at or above proficiency from 2013-2019
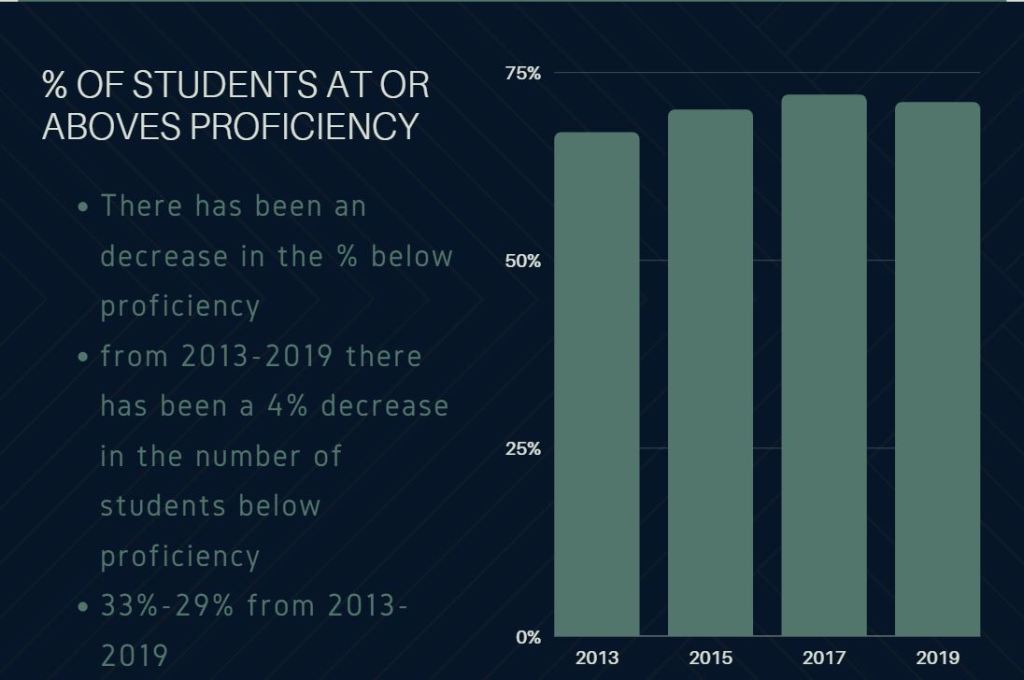
Unfortunately this picture is the same as the last. Not only has the number of students below proficiency increased, but the number at or above has also decreased.
This can be happening for many reasons, and before an accurate assumption can be made, more data would need to be collected. This data would need to include the county and district scores as well as demographics. But we can draw a larger implication from this data, which is that for the last 7 years, Delaware has had a period of contraction and stagnation in math proficiency. This likely means that whatever the statewide initiatives have been, have likely been ineffective.
